Newsletter
VOLUME 05 | May 2024
Markets and Economy
Battling the Inflation Allergen
It’s allergy season, which can mean itchy eyes, rattling sneezes, and pressure in your head and chest. While medicine can provide relief, a lower pollen count is the only sure remedy for most.
When it comes to the economy, the symptoms are different, but high inflation financially congests households and growth overall. Spending and borrowing typically slow down when the costs of goods and services go up. This was reflected in the retail sales data last month as gas and housing prices rose. Housing starts and building permits grew less than expected, and analysts pointed to higher interest rates as the culprit in a period when supply is at a record low. As a result, retail sales data showed no growth month to month in April. One of the big questions for the economy is when this inflation pressure will pass and allow the Federal Reserve to cut rates.
Fortunately, April brought some relief, as the consumer price index’s rate of change slowed to 0.3% month to month and the annual rate of inflation fell from 3.5% to 3.4% after three consecutive months of increases. Core inflation, which strips out the cost of energy and food, had its smallest gain in three years.
Investors reacted positively to the inflation report since it offers evidence that the Fed will be able to cut the fed funds rate later this year as expected (just in time for the elections). U.S. markets rallied moderately on the news, adding to the stock market gains we’ve seen in May, which included a “big” milestone for the Dow Jones Industrial Average.,
Is Dow 40,000 a Big Deal?
Much is being made of the Dow surpassing 40,000 for the first time. It seems like an important milestone, but these big round-number occasions are not as impressive when you put them in context.
A 1,000-point gain from 5,000 to 6,000, for example, represents a 20% increase. From 10,000 to 11,000 is just a 10% gain. And from 39,000 to 40,000 is just a 2.6% gain. In a rising market, we’ll pass these milestones more frequently, since the percentage gains needed get proportionately lower with each interval.
Any gain is a good one, but a 1,000-point move doesn’t mean quite so much at this index level. Keep that in mind when you hear or see media coverage that cites point gains without percentages.
While we’re poking holes in perceptions, let’s turn our eyes to how the Federal Reserve operates during election years.
Is the Fed Less Active in Election Years?
The economy is an evergreen campaign issue from the local to the national level, especially during presidential election years. Given the intense focus on which candidate’s policies will be best for the economy, do political factors influence the Fed’s decision-making?
As a reminder, the Fed is charged with setting monetary policy for the U.S. that supports maximum employment and stable prices. The bank’s Federal Open Market Committee’s primary tool for carrying out this responsibility is to make changes to the fed funds rate, a benchmark interest rate for banks and lending institutions.
Raising the fed funds rate makes it more expensive to borrow money, and it encourages consumers to save instead of spend since they earn higher interest rates on cash holdings. Lowering the fed funds rate encourages spending and borrowing, as you pay less interest on loans and earn less interest from bank accounts.
So, you see why interest rates and monetary policy can be a hot-button political issue. And while the Fed’s board of governors are nominated by the president and approved by the Senate, the bank itself is not a political entity. This is why board members serve 14-year terms, longer than a two-term president’s time in office by six years.
The numbers bear this out. We looked at Fed activity in all years from 1983 on and found that there was an average of 4.2 policy moves (interest-rate cuts or hikes) per year. During election years, the Fed on average has made 4.7 moves—more than in non-election years.
Our conclusion is that Fed policy moves are data dependent. The central bank won’t cut or hike if it doesn’t see a reason to, and political considerations are not a factor.
What’s Next?
The economy is showing some mixed signals, but the stock market is pressing forward. Overall S&P 500 company earnings reports for Q1 are a positive, though as we’ve observed in the past, the Magnificent Seven are playing an outsized role in driving growth.
It’s possible the dents in the economy are shallow enough to be smoothed out by a quick rate cut. Time will tell, but it is notable that after a few years of handwringing over recessions and bear markets, stocks are once again at all-time highs. It just goes to show that investors who remain patient, focus on the long-term and ignore the noise are rewarded, just as they have been throughout history.
We believe this goals-focused approach is the best medicine for seasonal irritants and prospering through economic and market cycles. Our emphasis continues to be on your financial health and your long-term wealth plan.
RWA Wealth Partners in the Media
Director of Estate and Trust Services Rawson Hubbell was featured in a CNN Underscored article on the importance of designating contingent beneficiaries in your estate documents. He shares critical considerations when setting up a new account and picking who to name. Click here to read the article now.
Please speak to your advisor if you have any questions about your beneficiary designations. We advise reviewing your chosen beneficiaries on financial accounts and in your estate documents every year to make sure they are up to date and reflect your wishes.
Seasonal Market Trends
Sell in May and Go Away? No Way!
If you’re considering a break from stocks this summer, think again. We touched on this strategy in the April edition of our newsletter; this article takes a deep dive into the data behind our advice.
It’s finally time to swap out sweaters for short sleeves and clear winter debris from the yard. This ritual of spring cleaning prepares us all to enjoy sunnier skies and warmer weather. On Wall Street, some investors have a similar ritual for their portfolios—selling stocks and investing in cash.
Why? The sell-in-May-and-go-away theory asserts that stocks don’t perform as well between May and October as they do during other months. Therefore, the reasoning goes, you should sell your holdings and place the proceeds in cash for six months to avoid downturns. Then you buy your stocks back in November and remain invested through April, a time frame during which markets have historically done better.
Is there any truth to this?
Are Stocks Just a Cold Weather Accessory?
Surprise! At first blush, the claim that stock performance from November through April is better than from May through October is grounded in fact. Since November 1973, the average six-month total return from fall to spring has been 8.2% for stocks (represented by the S&P 500 index), compared with a 3.3% average from May through October. However, that doesn’t reveal the full picture.

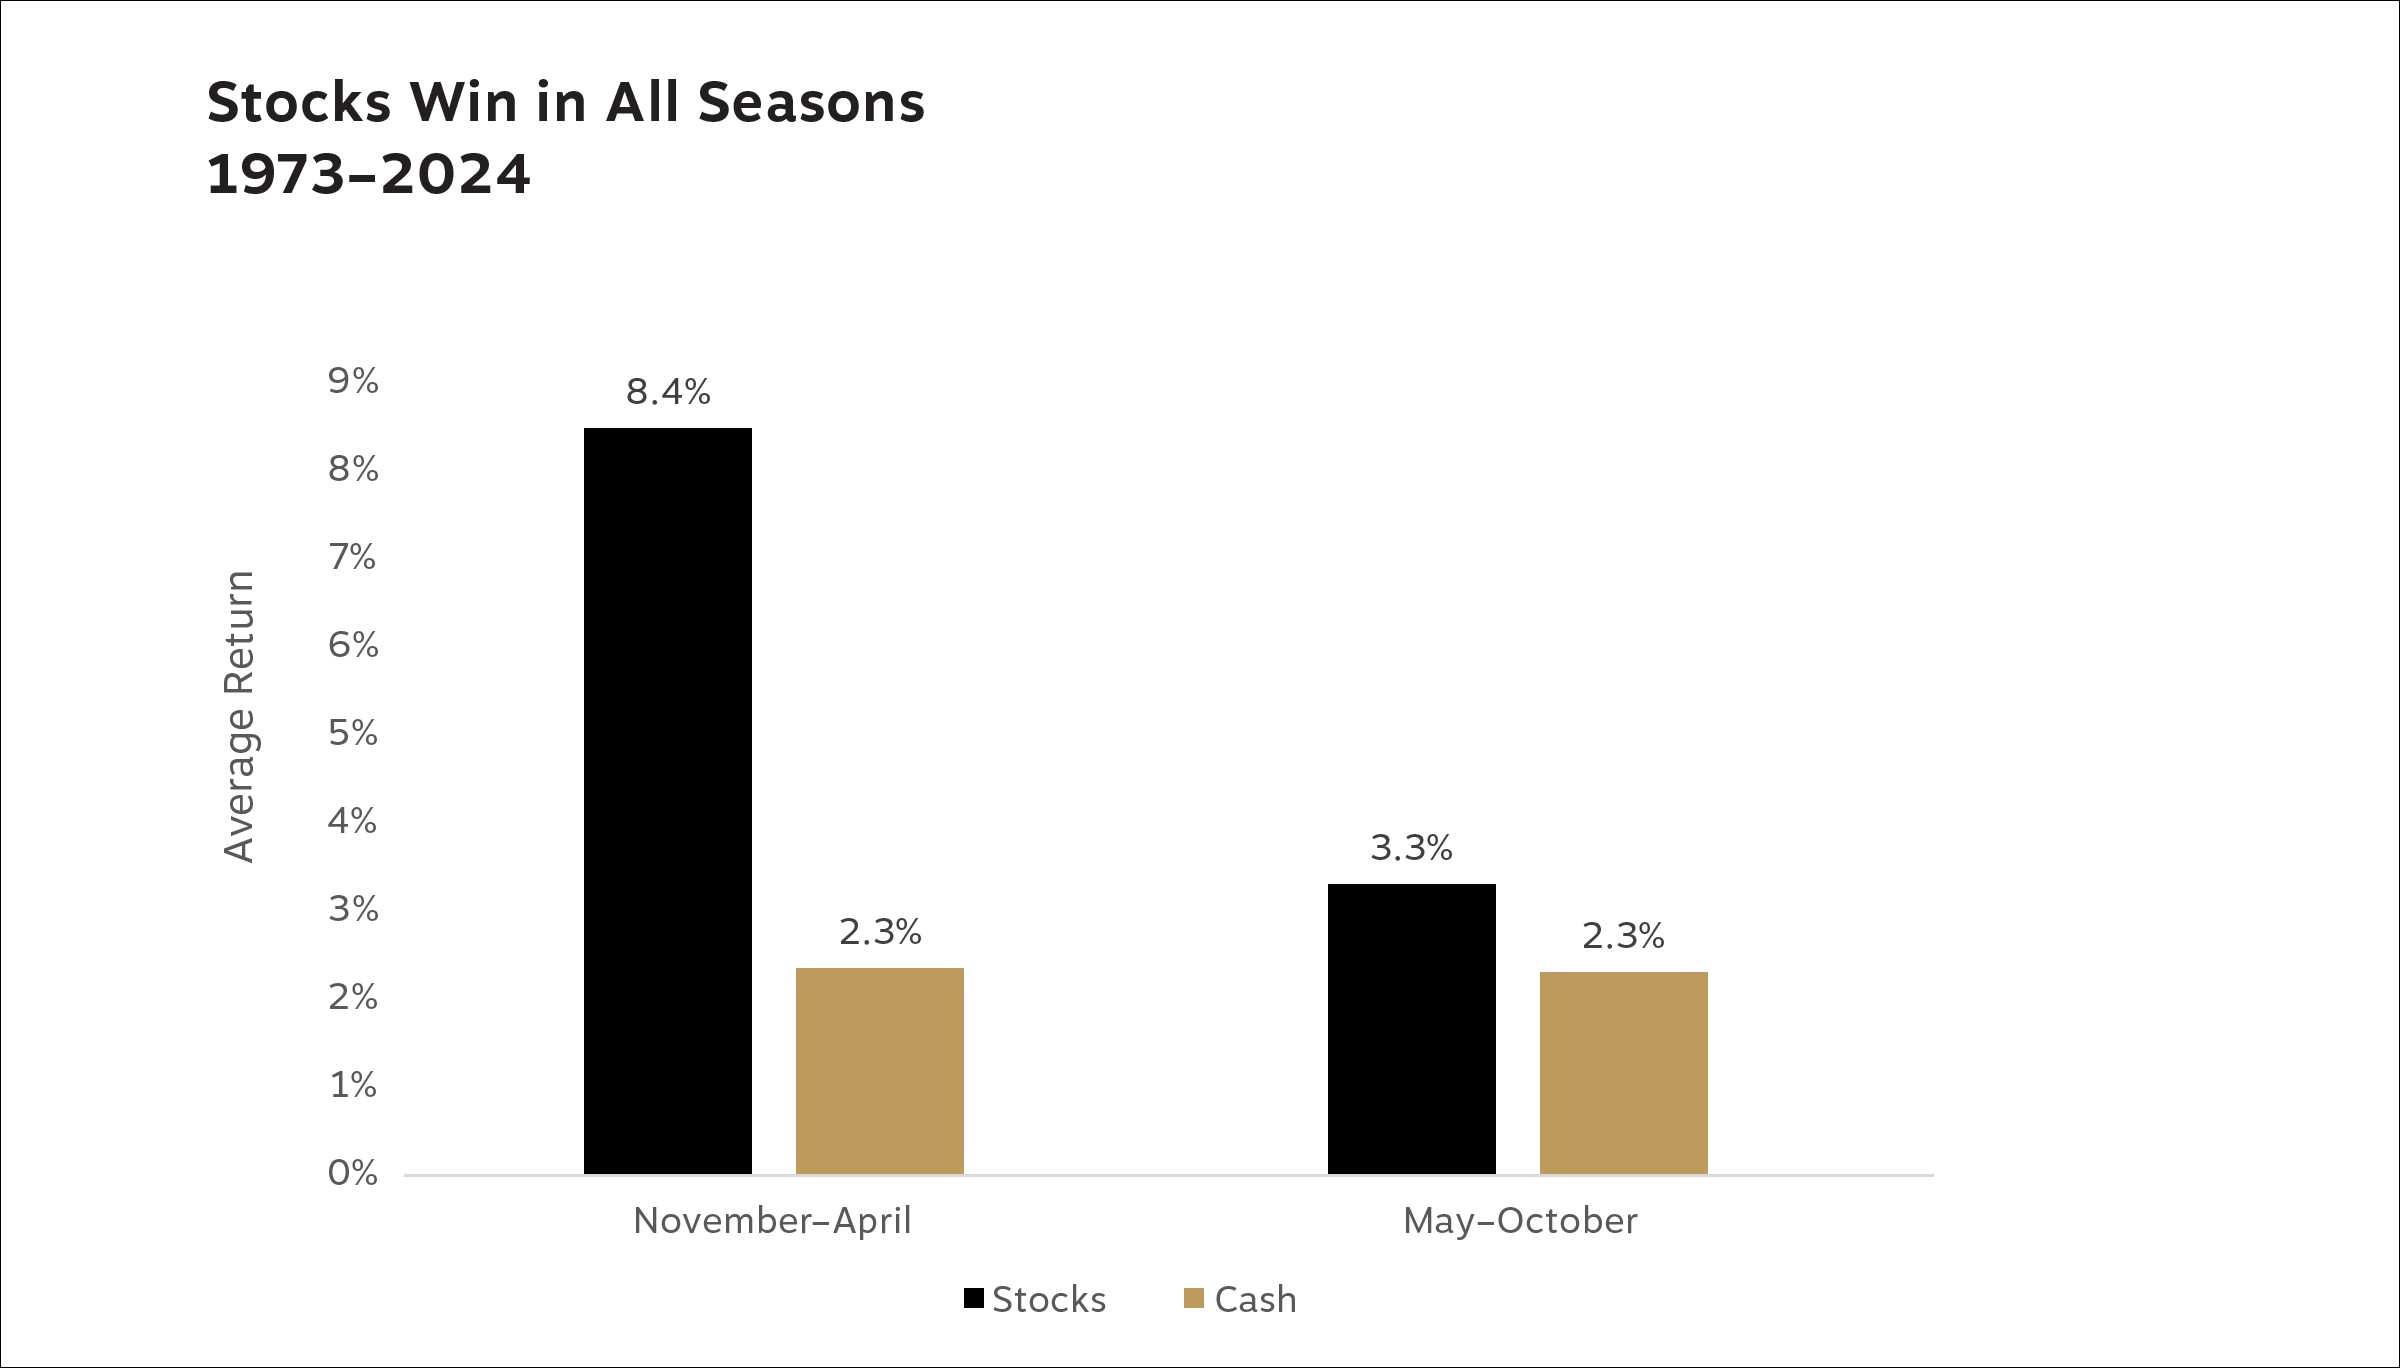
Unfortunately for proponents of selling in May, substituting cash for stocks has not been a winning move. Over the last 50 years, the average return for cash (represented by three-month Treasury bills) during the May–October period has been 2.3%, a full percentage point less than stocks. For the full November 1973 to April 2024 period, the sell-in-May strategy generated a 10.5% annualized gain while stocks had an 11.1% return.
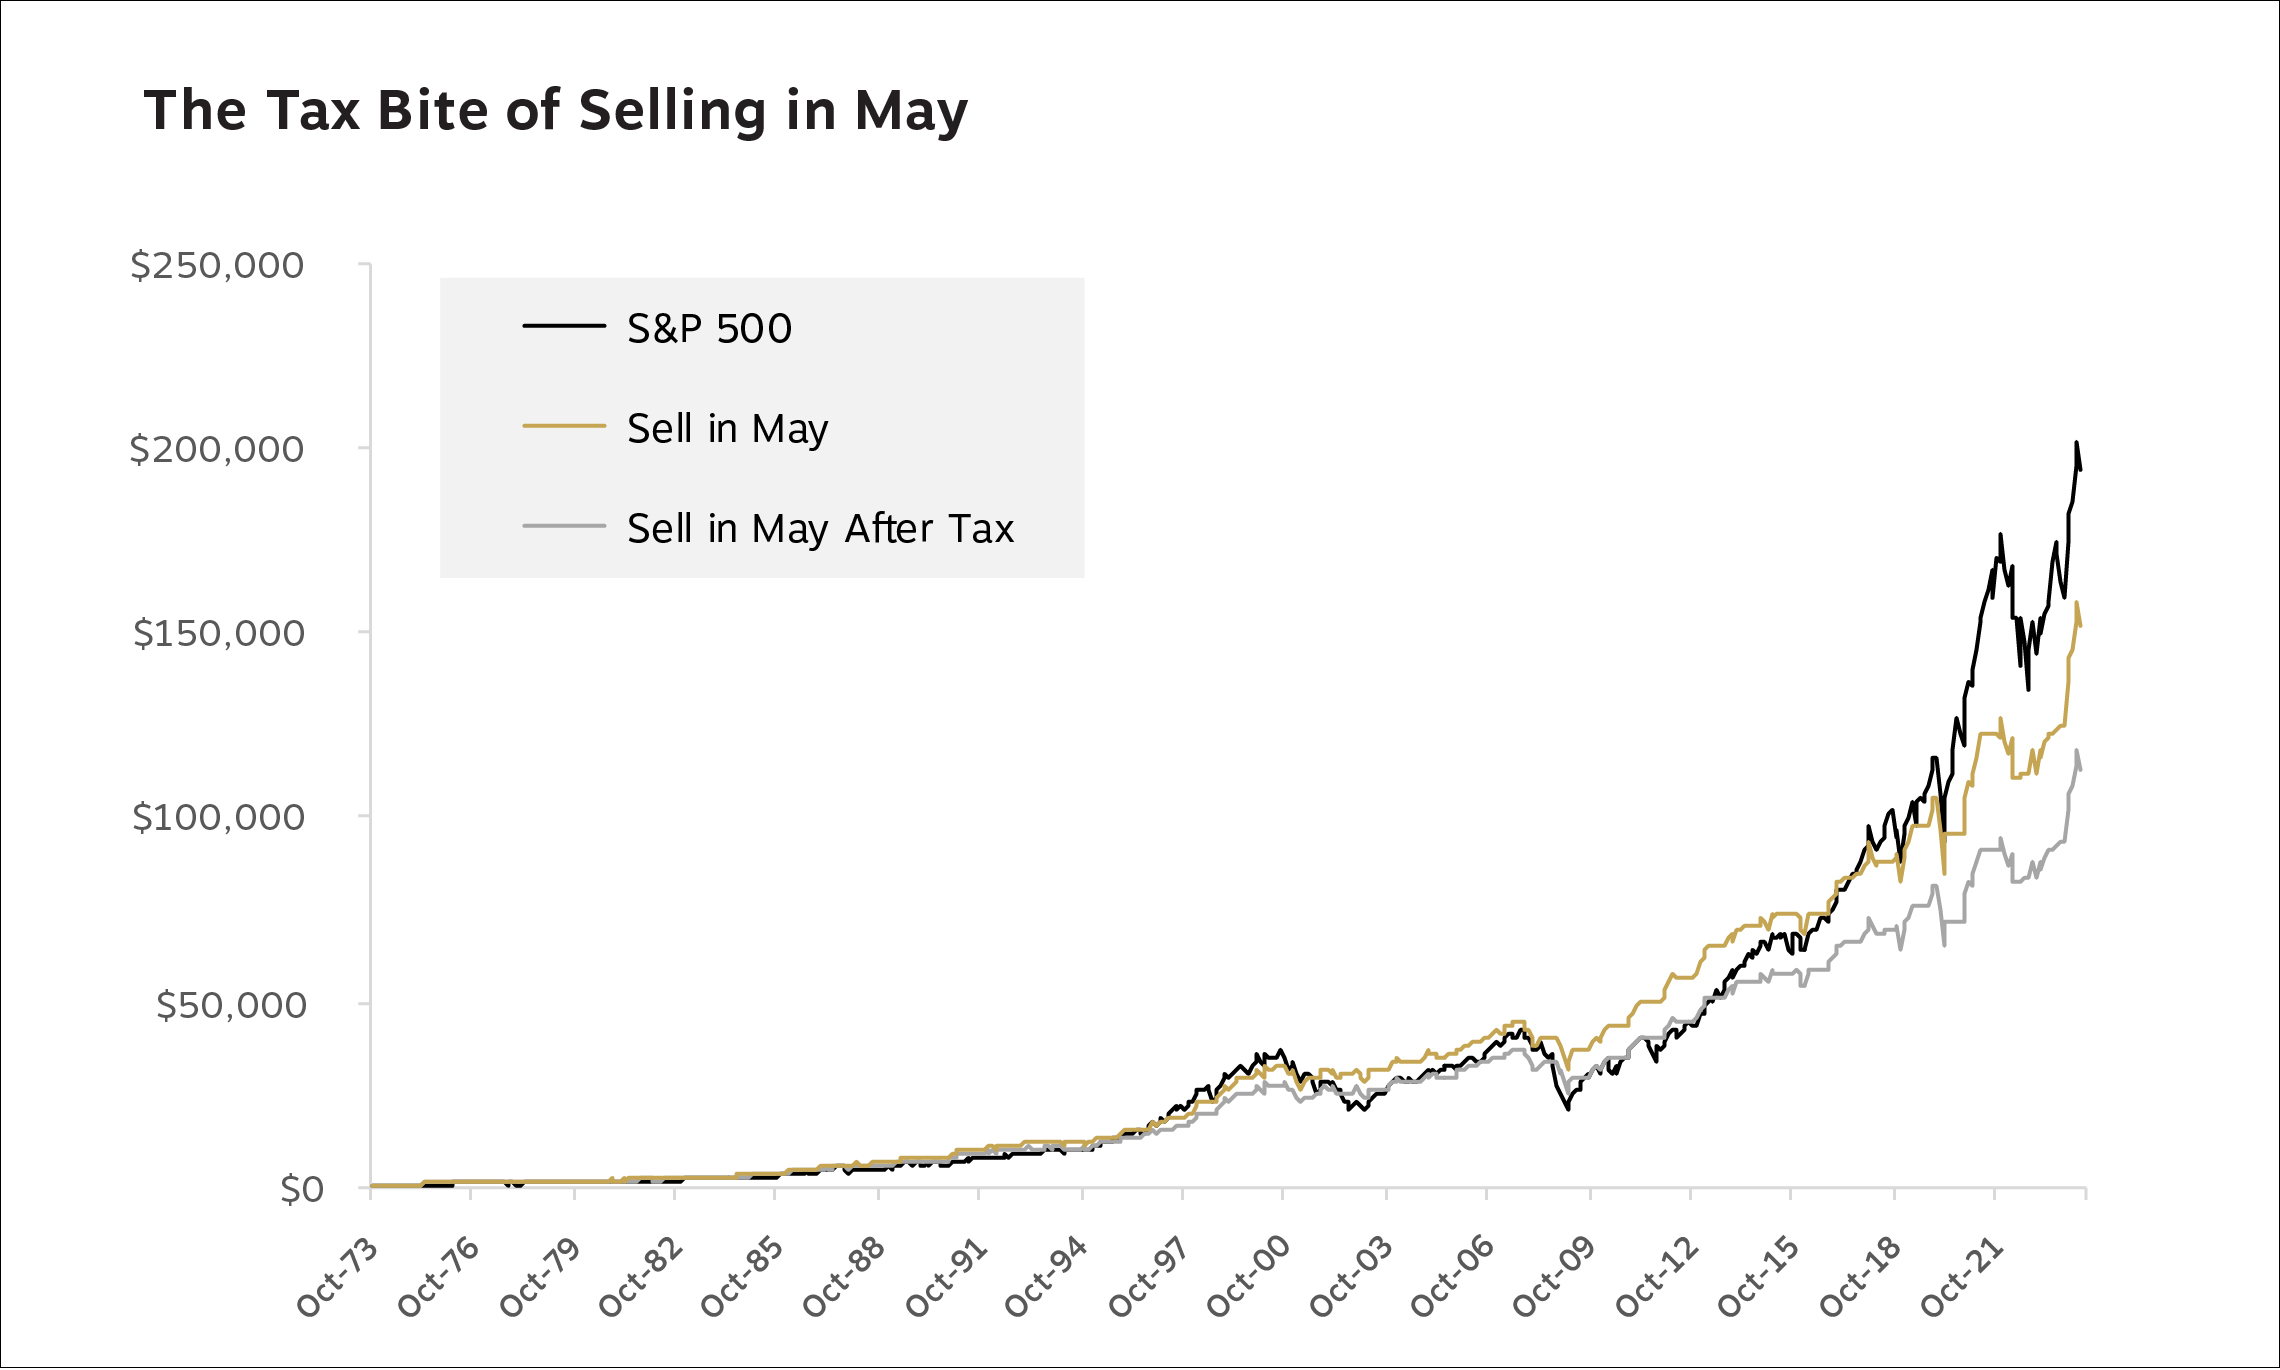
That seems like a small difference, but it adds up over 50 years: $1,000 invested in a sell-in-May strategy grew to just over $158,000. But holding only stocks turned that $1,000 into more than $201,000. Put another way, following a sell-in-May scheme deprived you of 22% of your potential gains.
Don’t Forget About Uncle Sam
If you apply the sell-in-May strategy to a taxable account, factoring in the impact of short-term capital gains taxes for each spring’s stock sale, it puts you even farther behind. Using this strategy would generate an annualized return of 9.9%, compared with 11.1% for buying and holding stocks. The end value after 50 years is just 58% of what you’d have pretax from a buy-and-hold stock strategy. The chart below shows hypothetical growth of $1,000 following the different strategies and the large discrepancy in ending values.

Does Selling in May Ever Work?
As is often the case with myths, there is a thread of truth woven into the tale. We already know that stocks typically perform better in the cooler months. And there have been years when selling in May would have paid dividends. In fact, it’s worked for the last two years in a row.

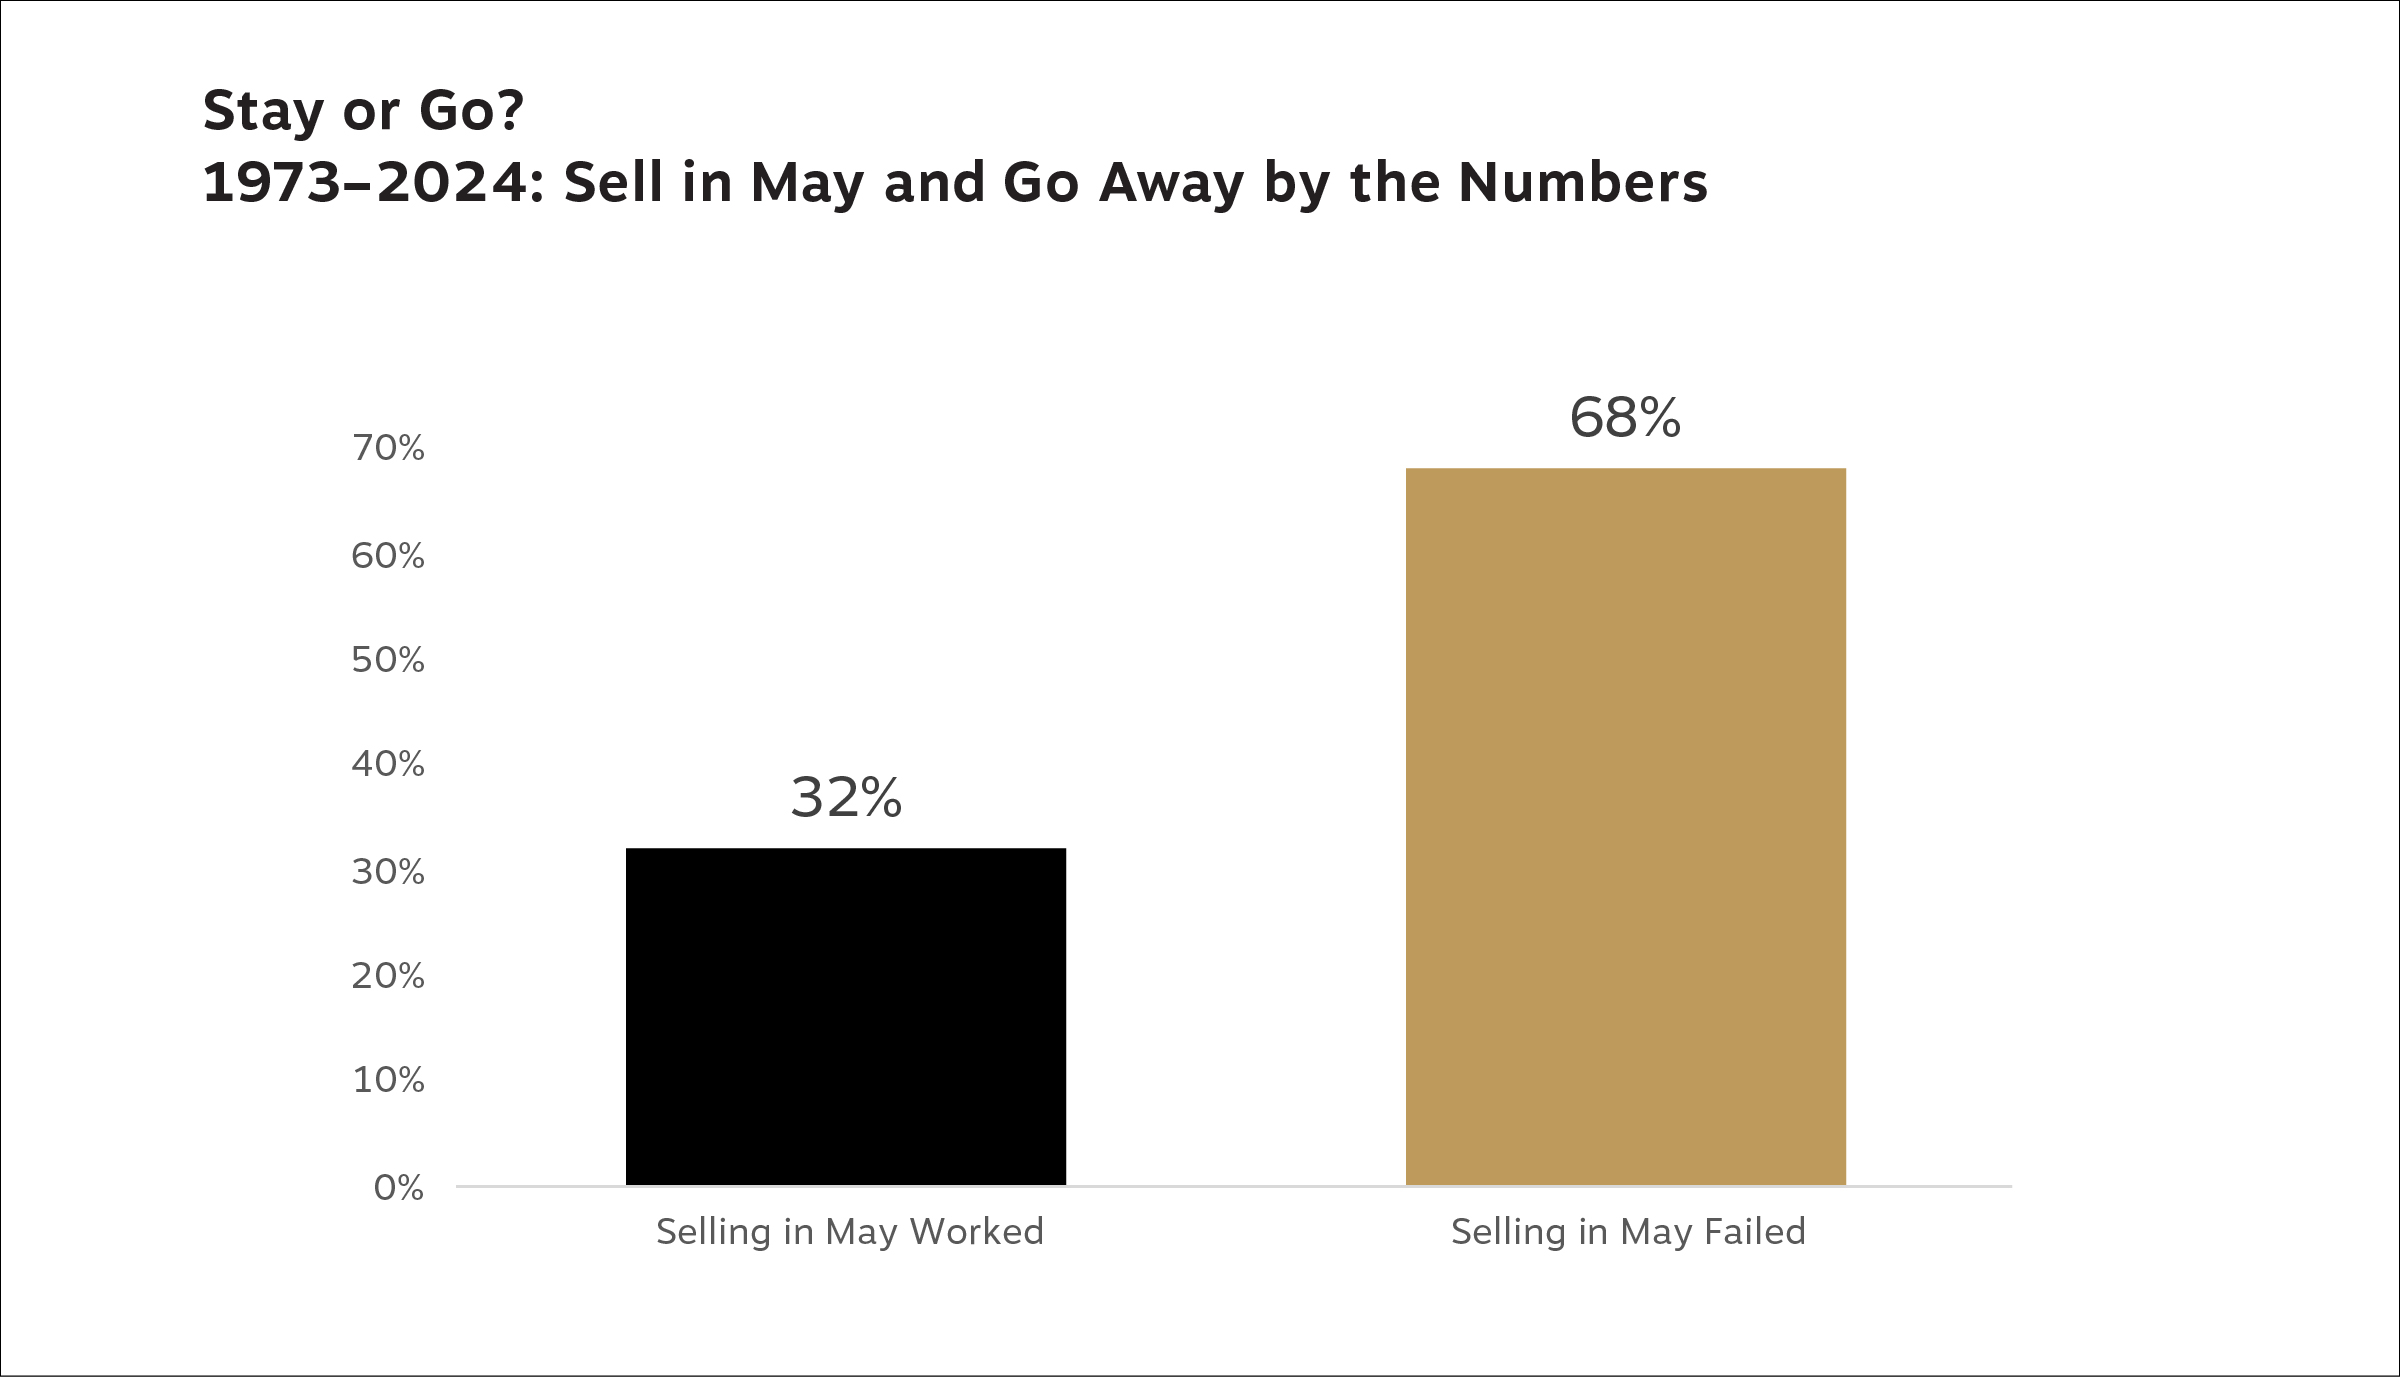
But don’t get your hopes up for a threepeat—it’s unlikely. Those two successful instances were preceded by 10 consecutive years when the strategy failed (eight of which are shown in the table above). And over the 50 years we analyzed, the strategy only worked 16 times, or 32% of all years. The other 68% of the time, you would have been better off holding stocks.

So, while it may be time to put your parka away and pull out sundresses and summer slacks, leave the sell-in-May-and-go-away strategy in the closet. Time has shown that stocks are more fashionable for long-term investors than cash, no matter the season.
TCJA Tax Planning
4 Strategies for 2025 and the Expiration of the Tax Cuts and Jobs Act
The 2024 tax season is over—let the 2025 tax season begin!
Our tax team is excited about finding savings, creating efficiencies and positioning you for success in the years ahead. Planning is particularly critical right now because of looming changes to the tax code. We believe there is enormous value in a tax strategy that’s integrated with your comprehensive financial plan, especially given the massive tax event on the horizon.
We are preparing for the expiration of the Tax Cuts and Jobs Act (TCJA) and higher tax rates in 2026. This gives us a window to refine your financial plan and tax strategy—but that window is closing fast.
With this in mind, the RWA Tax Solutions team created the checklist below. Whether we prepare your taxes or not, we recommend discussing these points with your advisor to discover the best path forward for you.
4 Strategies for Tax Savings and TCJA Expiration Preparation
1. Roth Conversions
- Consider converting funds from a traditional IRA to a Roth IRA to pay taxes at current rates instead of the higher rates you may face should the TCJA expire.
- Opt for Roth conversions if you can afford the tax bill, you won’t need the assets for five years, you anticipate being in a similar or higher tax bracket in retirement, and you can decrease overall tax liability at conversion.
2. Strategic Business Planning
- Accelerate your business’s dividends to align with personal income planning. This could help to avoid higher tax rates in the future.
- Maneuver pass-through business income to maximize deductions before business tax breaks sunset with the TCJA.
3. Itemization Strategies
- Anticipate a rollback of the standard deduction and prepare for the return of more itemized deductions.
- Consider deferring state and local tax payments to maximize deductions post-TCJA and broaden your approach to itemization.
4. Wealth Transfer and Charitable Giving
- Prioritize wealth transfer through 2025 to take advantage of current estate tax exemptions.
- Establish spousal lifetime access trusts (SLATs) or other trust structures for advanced estate planning to mitigate future tax vulnerabilities.
- Increase charitable giving before deductions decrease post-2025 and consider setting up donor-advised funds for flexibility in future donations.
This checklist scratches the surface of what we can do for you. Interested in creating or refining your tax plan to lower your bracket and preserve your legacy? Please contact your advisor to get started before time runs out.
For more on the expiration of the TCJA and how we can help, read our in-depth article from Head of Tax Services Bob Johnson, CPA: The Tax Cuts and Jobs Act Expires Soon: Are You Prepared?
This material is distributed for informational purposes only. The investment ideas and opinions contained herein should not be viewed as recommendations or personal investment advice or considered an offer to buy or sell specific securities. Data and statistics contained in this report are obtained from what we believe to be reliable sources; however, their accuracy, completeness or reliability cannot be guaranteed.
Our statements and opinions are subject to change without notice. You may request a free copy of the firm’s Form ADV Part 2, which describes, among other items, risk factors, strategies, affiliations, services offered and fees charged.
All investments carry risk of loss. Past performance is not an indication of future returns. Diversification does not ensure a profit or protect against a loss. Options involve risk and are not suitable for all investors. Tax, legal and insurance information contained herein is general in nature and should not be construed as legal or tax advice, or as advice on whether to buy or surrender any insurance products. Personalized tax advice and tax return preparation may be available through a separate, written engagement agreement with our wholly owned subsidiary, RWA Tax Solutions, LLC. We do not provide legal advice nor sell insurance products. Legal services may be available via a separate, written engagement agreement through our exclusive relationship with Hall & Diana LLC.
Always consult a licensed attorney, tax professional, or licensed insurance professional regarding your specific legal or tax situation or insurance needs.
Companies mentioned in this article are not necessarily held in client portfolios, and our references to them should not be viewed as a recommendation to buy, sell or hold any of them.
© 2024 RWA Wealth Partners, LLC. All Rights Reserved.